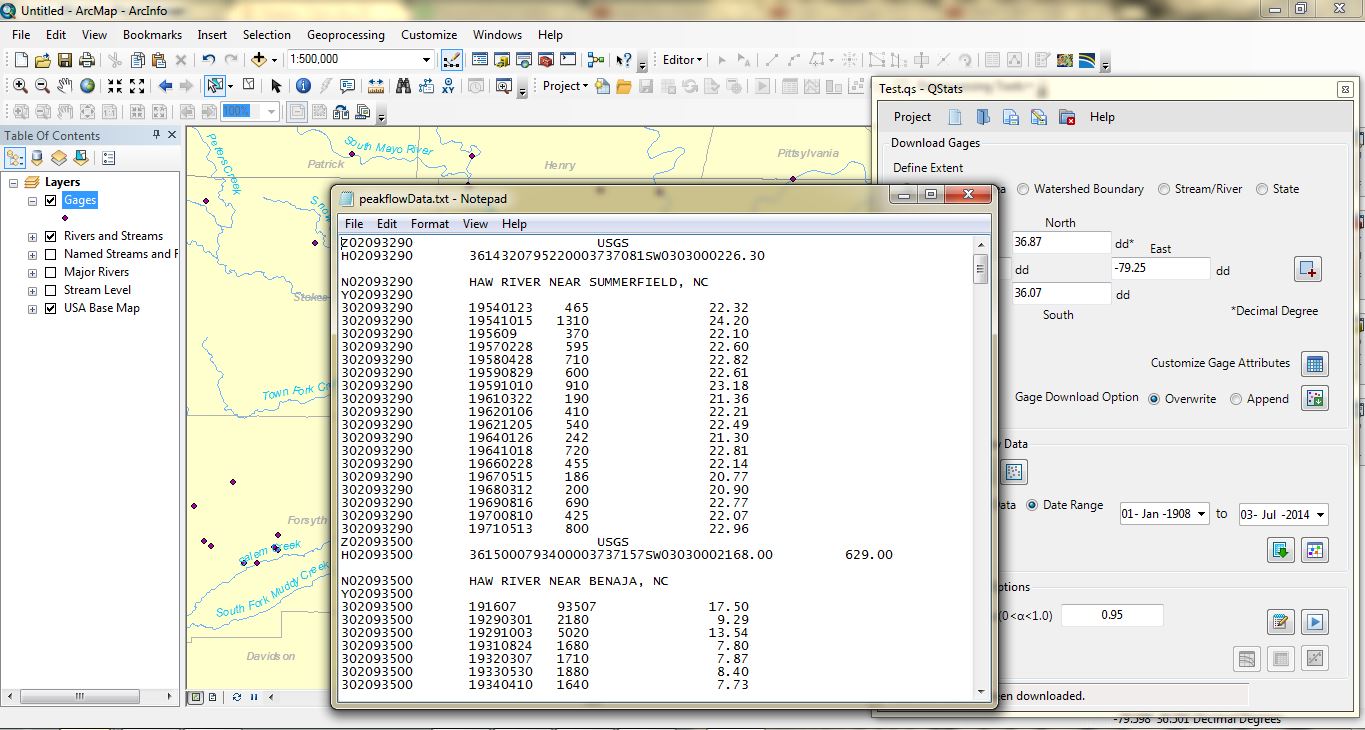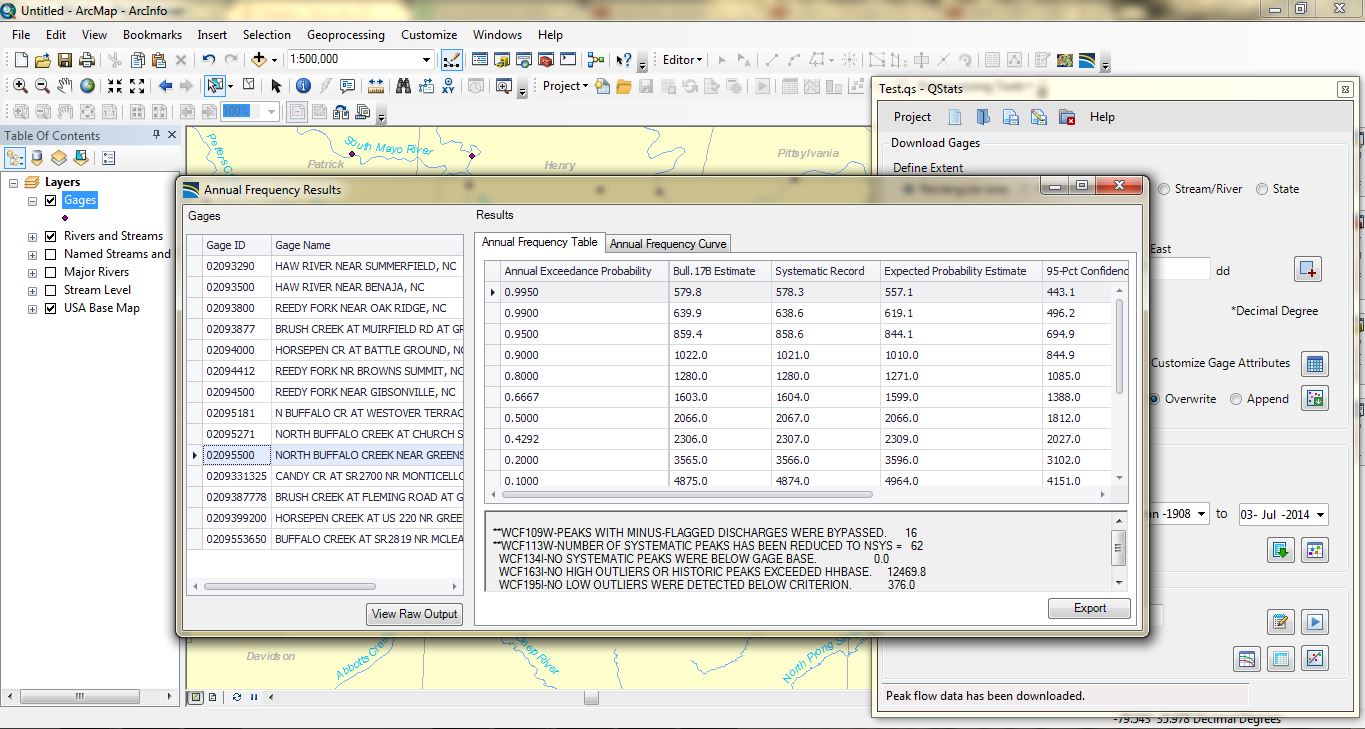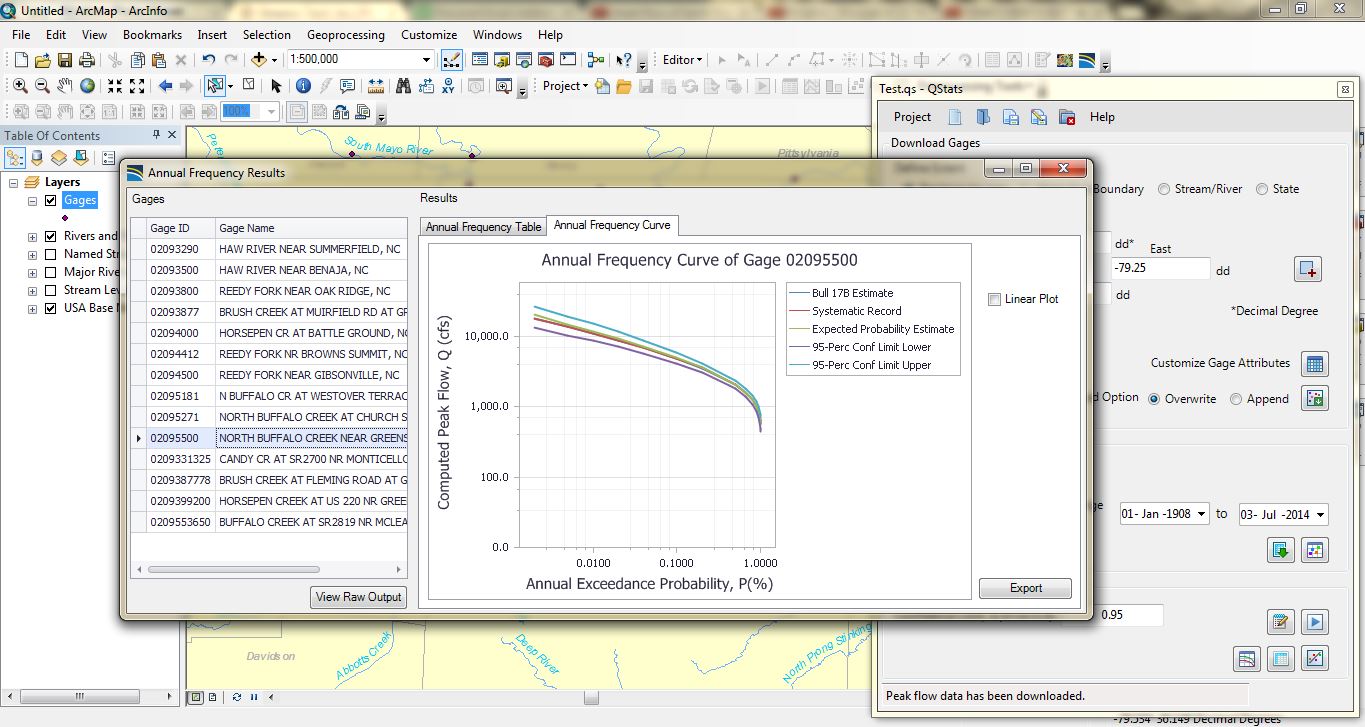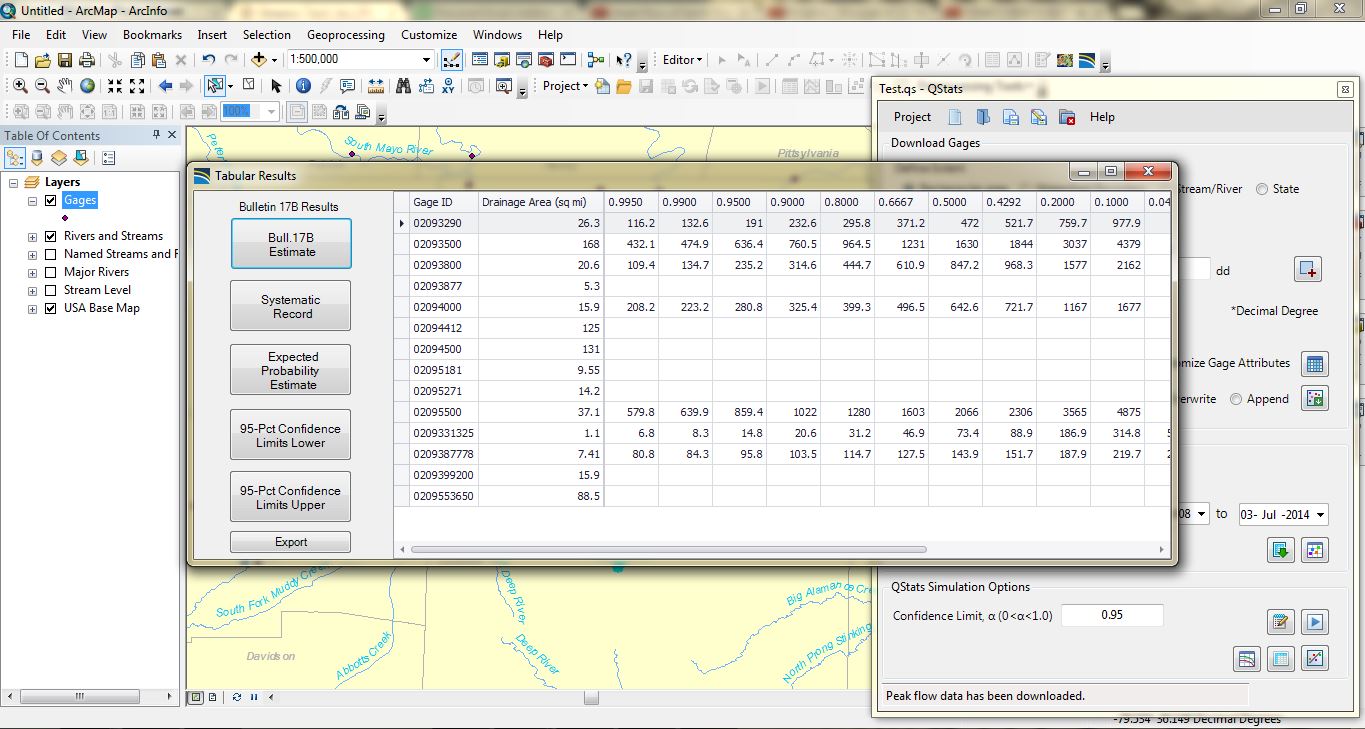


QStats™ performs statistical flood-frequency analyses of annual maximum peak flow data (annual peaks) in ArcGIS® platform using the program PeakFQ of US Geological Survey (USGS). Program PeakFQ applies the procedures recommended in Bulletin 17B of the Interagency Advisory Committee on Water Data (1982), commonly referred as Bulletin 17B, in the statistical analyses. QStats™ enables users not only to perform statistical analysis but also to manage them in projects in GIS platform. It provides ultimate flexibility to a user in processing peak flow gages and data in the project geodatabase (GDB) and in interpretation of analysis results. The most attractive feature is that any user can make real time download of peak flow gages (on map) and data instantly after setting a QStats™ project. QStats™ stores spatial and attribute information of the downloaded gages in the project GDB. In a QStats™ project, a user can make unlimited statistical simulations with his input parameters, and can interpret output results under different probability scenarios. QStats™ has wide application in estimating flood peak flows, at given recurrence intervals, from the observed data of peak flow gage that are installed throughout the entire hydrologic regions of US. Flood frequency analysis is essential for the design of hydraulic structures and flood plain management. In this context, QStats™ can play the role of the decision support tool for the planners and designers.